
The InfiPlex SKU Cost of Goods Report shows margin and profit per SKU, broken down by order source, over any date range you choose. It only works correctly if Item Cost is set for your SKUs. Without it, Cost of Sales, Margin, and Profit will be wrong or show as zero.
What Can You Use the SKU Cost of Goods Report For?
- Check margin and profit by SKU. See which products are actually profitable, not just which ones sell the most units.
- Compare profitability by order source. The same SKU can carry a different cost on one channel than another, so profit on that SKU can vary by where it sold.
- Spot trends over time. The chart under each order source shows how sales, cost, and profit moved day by day across the date range.
How Do I Set Item Cost?
Item Cost can be set on the product add/edit screen as a single default for the SKU. Keep that to a minimum. Actual cost usually varies by order source, so setting cost at the order source level gives a more accurate report:
- Manually: go to Tools > SKU Data and add a value named {order source}_cost, for example Wayfair_cost or Home Depot_cost.
- By upload: use the SKU Utilities Tool with a CSV containing a column in that same {order source}_cost format.
If a SKU sells on an order source with no matching cost override, the report falls back to that SKU's default cost.
Where Do I Find the SKU Cost of Goods Report?
Reports > SKU CoG. The page itself is titled SKU Cost of Goods.
How Do I Run the SKU Cost of Goods Report?
- Range: the date range to report on.
- SKUs: up to 10 SKUs, comma separated, for example sku1,sku2,sku3.
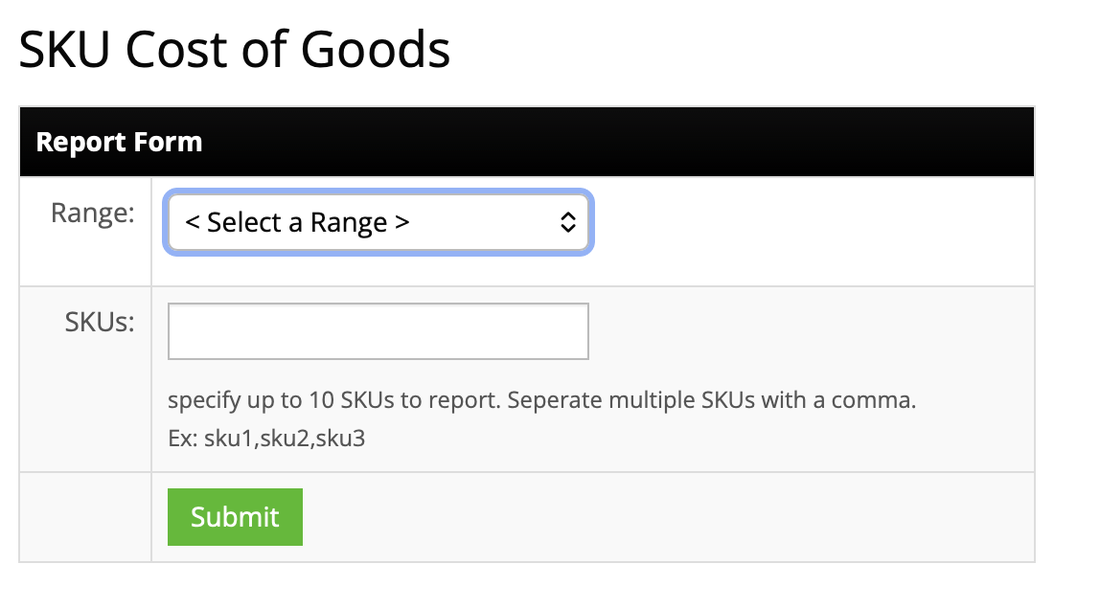
There's no export option on this report. Results are for on-screen review.
What Do the SKU Cost of Goods Report Results Show?
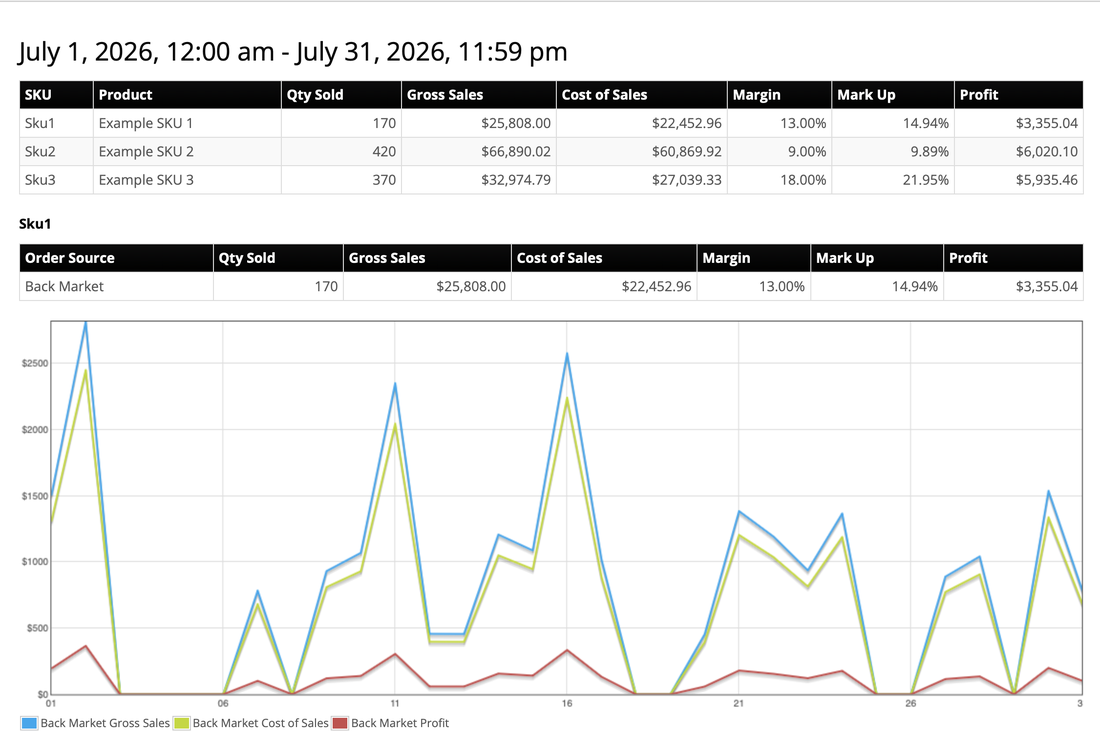
Results are structured in two layers. First, a summary table with one row per SKU you queried, totaled across every order source it sold on. Below that, each SKU gets its own breakdown: a table splitting that SKU's totals by order source, and a chart plotting Gross Sales, Cost of Sales, and Profit day by day for that order source.
Every row in either table uses the same columns:
| Column | What It Means |
|---|---|
| Qty Sold | Units sold in the date range. |
| Gross Sales | Total revenue before cost. |
| Cost of Sales | Total Item Cost for the quantity sold. |
| Profit | Gross Sales minus Cost of Sales. |
| Margin | Profit divided by Gross Sales. |
| Mark Up | Profit divided by Cost of Sales. |
Margin and Mark Up answer different questions on the same dollars. A SKU with $25,808.00 in Gross Sales, $22,452.96 in Cost of Sales, and $3,355.04 in Profit shows a 13% Margin (profit as a share of revenue) and a 14.94% Mark Up (profit as a share of cost).
SKU Cost of Goods Report Questions
What's the difference between Margin and Mark Up?
Margin is Profit divided by Gross Sales, the profit as a share of what the item sold for. Mark Up is Profit divided by Cost of Sales, the profit as a share of what the item cost.
Why is Profit showing as $0 or Margin showing as negative?
Item Cost is likely not set for that SKU, or not set for the order source it sold on. Set a {order source}_cost value in Tools > SKU Data, or a default cost on the product's add/edit screen.
How do I set a different cost for one marketplace?
Go to Tools > SKU Data and add a value named {order source}_cost, for example Wayfair_cost. You can also bulk upload these with the SKU Utilities Tool. This order-source-level method is recommended over the single default cost on the product edit screen.
How many SKUs can I check at once?
The SKU Cost of Goods Report supports up to 10 SKUs per run, separated by commas.
Can I export the results?
No. The SKU Cost of Goods Report has no export option. Results are for on-screen review only.
Need Something This Report Doesn't Cover?
Contact Us and we'll take a look. Support is included with every InfiPlex plan.
See every report InfiPlex includes
SKU Cost of Goods Report is one of four built-in reports, covering shipping, cost, orders, and marketplace settlements.